From hdouble:
I dabbled in a bit of horse racing handicapping recently, and while it had a much different flavor than my old econometrics classes, the method was very similar. In econometrics, the economist basically takes a glob of numbers and figures out the meaningful patterns in these numbers. The “figuring out” requires both an expert knowledge of statistical techniques, and more importantly, knowledge and experience in the domain being analyzed. In handicapping a horse race, the expert takes in the data from various input (e.g. The Daily Racing Form, Past Performances, etc.) and determines the “shape” of the race– the expert can visualize the way the race will play out based on knowledge of what the statistics mean and his experience with the relationship between the statistics and past race outcomes.
Aside: In fact, I think that the difference in ability to make sense of, or “filter”, sensory data (primarily visual and cognitive) differentiates the best poker players in the world. Basically, Phil Ivey is an expert at stripping away the useless sensory data and focusing on the information that reveals the type of hand his opponent holds. But that’s a topic for another post…
For a long time, I’ve wondered if there is some statistical commonality between winning poker players. I think that many different styles can be successful for different players– some players are tight aggressive winners, and some get bored playing that style and can only succeed as loose aggressive players. But the numbers never lie– what if there was some common statistic that all winning players shared? What if there was something hidden in the mess of data that might clue one in to some optimal way of playing poker?
To extract the wisdom of the statistics gathered from millions of hand histories… To “mine” the poker knowledge contained in every hand played by good and bad players…
I’ve started on this path, and although I don’t think I’ve found any diamonds yet, the mining has just begun. For now, I’m hoping a surface-level investigation of the data will reveal some interesting patterns and lead me to better questions.
Before we get into the asking and answering of questions, let me fill you in on the basic characteristics of the data:
All hands come from Party Poker, $15/$30 Fixed Limit or above, where there were at least 7 players in the hand
For now, I’m limiting the analysis to players with more than 4,000 hands observed– this leaves us with 115 players, a relatively small sample, but large enough to make some reasonable conclusions
Data collection began on April 26th, so it is safe to assume that the majority of the players in the analysis are “pros,” since observing over 4K hands for a single player means they were playing nearly every day for several hours
Question 1: How many of these “pros” are winners?
We’d have to guess that significantly more than half of the players with over 4,000 hands in a relatively short period of time are winners– if they play that much, they definitely have the discipline to grind it out, an attribute usually correlated with winning. Also, they are still playing, which means they didn’t go broke.
Answer: 68 winners (59%), 47 losers (41%)
37% of the 68 winners made more than 2 big bets per 100, and 59% made more than 1 big bet per 100, suggesting that these folks are making a nice hourly rate (nearly all of the players in the sample were $30/$60 players).
As suspected, the grinders are grinding out a nice win rate, and most of the winners are making between 1 and 2 bb/100. This fits with the Sklanskyish estimates of win rate in reasonably tough games.
Question 2: How much are the winners winning and the losers losing?
Answer: 57% of all players won between 0 and 2 big bets per 100 hands.
The histogram shows that although most winners fall in the 0-2 bb/100 range, 11 (10%) of the 115 players were “big winners,” winning at least 3 big bets per 100 hands. The average number of hands per table hour in this group was 70, so if these players are 4 tabling, that puts their true win rate at $432 per hour. The query for true win rate is a bit hard to formulate, so I’ll save that one for later.
Among losers, 14 players (30%) lost more than 1 big bet per 100, and 11 of these lost more than 2 big bets per 100, compared to 22 players who won more than 2 big bets per 100. Not surprisingly, the losers either stop playing or drop down in limits, while the winners don’t go anywhere.
Question 3: How tight are the winners playing (more specifically, what percentage of hands are they voluntarily putting money in the pot with)?
Answer: 61% of the winners were between 15% and 21% VPIP.
 The above shows that playing tight works well in the Party -, but it isn’t the only way to win. The top 3 winners in dollar amount won all had a vpip% of 20%. “Tight is right” theorists point to the 4th leading winner by dollar amount, who had a VPIP% of 15% (and a win rate of 1.66 bb/100), meaning he plays premium hands only. Those who advocate looser play look to the 6th leading winner in dollar amount won, with a VPIP% of 29% and a win rate of 2.8 bb/100.
Question 4: How much do the winners raise before the flop?
Answer: 60% raised pre-flop between 10% and 13% of the time.
Comparing the pre-flop raise % with the VPIP above shows us that the majority of winning players nearly always come into the pot with a raise. I haven’t run the query to check for this, but since the average vpip% for winners exceeds the average pfr% by only 6%, it is clear that most of the hands played are for a raise. When you factor in blind defense, it’s evident that most winners rarely limp or call raises preflop, but nearly always raise.
Question 5: How often do the winners win when they show down a hand?
Answer: 59% of winners were in the 51% to 57% range.
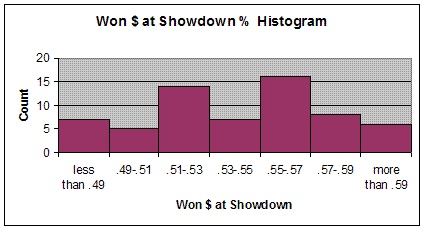 This statistic always interested me, because it’s a strong indicator of style. A player who shows down a lot of bluffs is going to get paid off more often, and possibly win bigger pots than the average non-bluffing player. Conversely, a weak-tight player is going to win more often when they do show down, but probably isn’t going to show down very often. While I think that this statistic is relatively useless for the most part, the major point is that winners win only slightly more than half the time they show down a hand.
So what does it all mean?
While I’m just scratching the surface, I think the above statistics tell us that:
Most of the pros at $30-$60 are doing quite well
A small percentage of players are killing the game, and a smaller percentage are getting killed
A win rate of 1 bb/100 puts you in the top 37% of winning grinders at this level
Most winners put money in voluntarily around 20% of the time
Most winners raise around 12% of the time, and rarely come into a pot without raising
Most winners take the pot slightly more than half the time they show down a hand
I dabbled in a bit of horse racing handicapping recently, and while it had a much different flavor than my old econometrics classes, the method was very similar. In econometrics, the economist basically takes a glob of numbers and figures out the meaningful patterns in these numbers. The “figuring out” requires both an expert knowledge of statistical techniques, and more importantly, knowledge and experience in the domain being analyzed. In handicapping a horse race, the expert takes in the data from various input (e.g. The Daily Racing Form, Past Performances, etc.) and determines the “shape” of the race– the expert can visualize the way the race will play out based on knowledge of what the statistics mean and his experience with the relationship between the statistics and past race outcomes.
Aside: In fact, I think that the difference in ability to make sense of, or “filter”, sensory data (primarily visual and cognitive) differentiates the best poker players in the world. Basically, Phil Ivey is an expert at stripping away the useless sensory data and focusing on the information that reveals the type of hand his opponent holds. But that’s a topic for another post…
For a long time, I’ve wondered if there is some statistical commonality between winning poker players. I think that many different styles can be successful for different players– some players are tight aggressive winners, and some get bored playing that style and can only succeed as loose aggressive players. But the numbers never lie– what if there was some common statistic that all winning players shared? What if there was something hidden in the mess of data that might clue one in to some optimal way of playing poker?
To extract the wisdom of the statistics gathered from millions of hand histories… To “mine” the poker knowledge contained in every hand played by good and bad players…
I’ve started on this path, and although I don’t think I’ve found any diamonds yet, the mining has just begun. For now, I’m hoping a surface-level investigation of the data will reveal some interesting patterns and lead me to better questions.
Before we get into the asking and answering of questions, let me fill you in on the basic characteristics of the data:
Question 1: How many of these “pros” are winners?
We’d have to guess that significantly more than half of the players with over 4,000 hands in a relatively short period of time are winners– if they play that much, they definitely have the discipline to grind it out, an attribute usually correlated with winning. Also, they are still playing, which means they didn’t go broke.
Answer: 68 winners (59%), 47 losers (41%)
37% of the 68 winners made more than 2 big bets per 100, and 59% made more than 1 big bet per 100, suggesting that these folks are making a nice hourly rate (nearly all of the players in the sample were $30/$60 players).
As suspected, the grinders are grinding out a nice win rate, and most of the winners are making between 1 and 2 bb/100. This fits with the Sklanskyish estimates of win rate in reasonably tough games.
Question 2: How much are the winners winning and the losers losing?
Answer: 57% of all players won between 0 and 2 big bets per 100 hands.
The histogram shows that although most winners fall in the 0-2 bb/100 range, 11 (10%) of the 115 players were “big winners,” winning at least 3 big bets per 100 hands. The average number of hands per table hour in this group was 70, so if these players are 4 tabling, that puts their true win rate at $432 per hour. The query for true win rate is a bit hard to formulate, so I’ll save that one for later.
Among losers, 14 players (30%) lost more than 1 big bet per 100, and 11 of these lost more than 2 big bets per 100, compared to 22 players who won more than 2 big bets per 100. Not surprisingly, the losers either stop playing or drop down in limits, while the winners don’t go anywhere.
Question 3: How tight are the winners playing (more specifically, what percentage of hands are they voluntarily putting money in the pot with)?
Answer: 61% of the winners were between 15% and 21% VPIP.
The above shows that playing tight works well in the Party -, but it isn’t the only way to win. The top 3 winners in dollar amount won all had a vpip% of 20%. “Tight is right” theorists point to the 4th leading winner by dollar amount, who had a VPIP% of 15% (and a win rate of 1.66 bb/100), meaning he plays premium hands only. Those who advocate looser play look to the 6th leading winner in dollar amount won, with a VPIP% of 29% and a win rate of 2.8 bb/100.
Question 4: How much do the winners raise before the flop?
Answer: 60% raised pre-flop between 10% and 13% of the time.
Comparing the pre-flop raise % with the VPIP above shows us that the majority of winning players nearly always come into the pot with a raise. I haven’t run the query to check for this, but since the average vpip% for winners exceeds the average pfr% by only 6%, it is clear that most of the hands played are for a raise. When you factor in blind defense, it’s evident that most winners rarely limp or call raises preflop, but nearly always raise.
Question 5: How often do the winners win when they show down a hand?
Answer: 59% of winners were in the 51% to 57% range.
This statistic always interested me, because it’s a strong indicator of style. A player who shows down a lot of bluffs is going to get paid off more often, and possibly win bigger pots than the average non-bluffing player. Conversely, a weak-tight player is going to win more often when they do show down, but probably isn’t going to show down very often. While I think that this statistic is relatively useless for the most part, the major point is that winners win only slightly more than half the time they show down a hand.
So what does it all mean?
While I’m just scratching the surface, I think the above statistics tell us that: